AI-Powered Infographic Generation
Transform your text content into beautiful infographics in Seconds
Transform Text into Beautiful Infographics in Seconds
No design skills, no complex software. AI automatically analyzes your content, extracts key information, and applies professional design principles to create stunning infographics.
10x
Content Creation Efficiency
90%
Design Time SReady to create your ownved
75%
Improved Information Retention
AI-Generated Infographic Examples
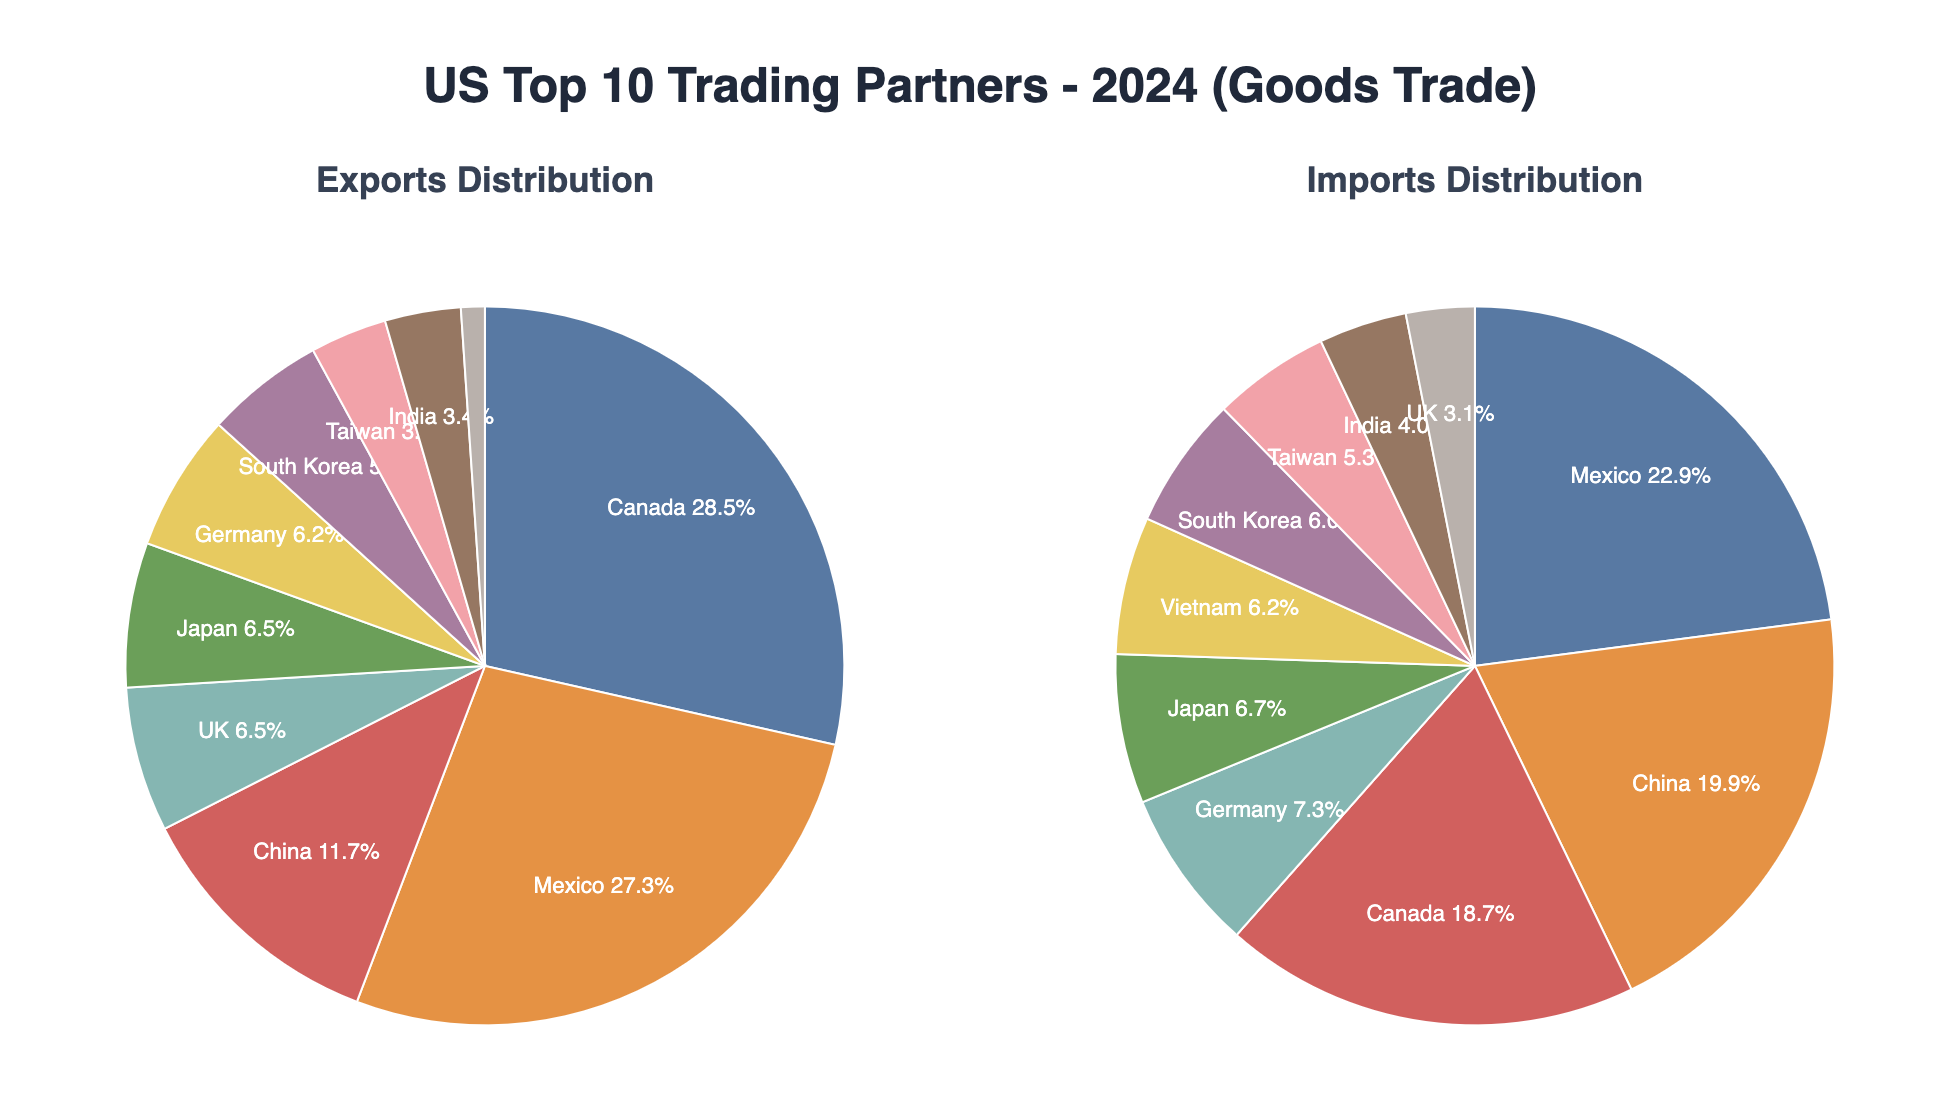
Data Visualization
Transform complex statistics into easy-to-understand charts
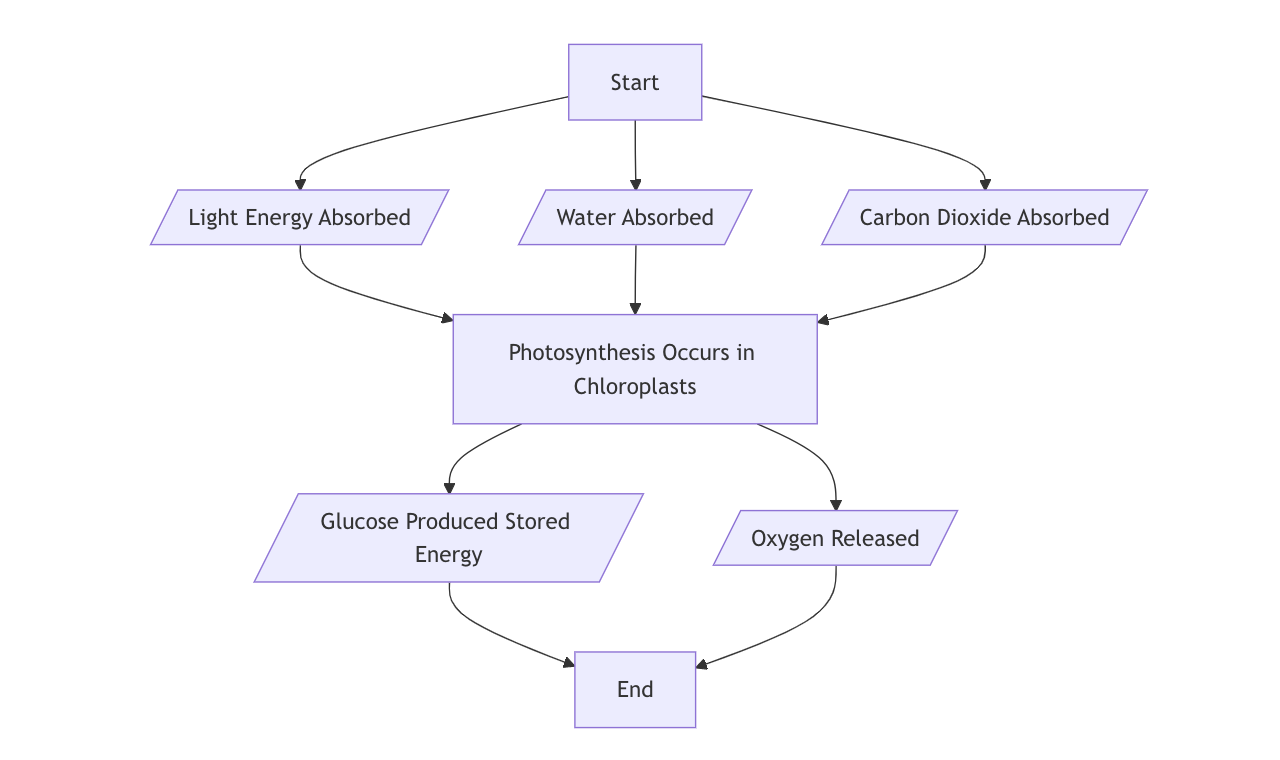
Process Flowcharts
Clearly illustrate work or project processes
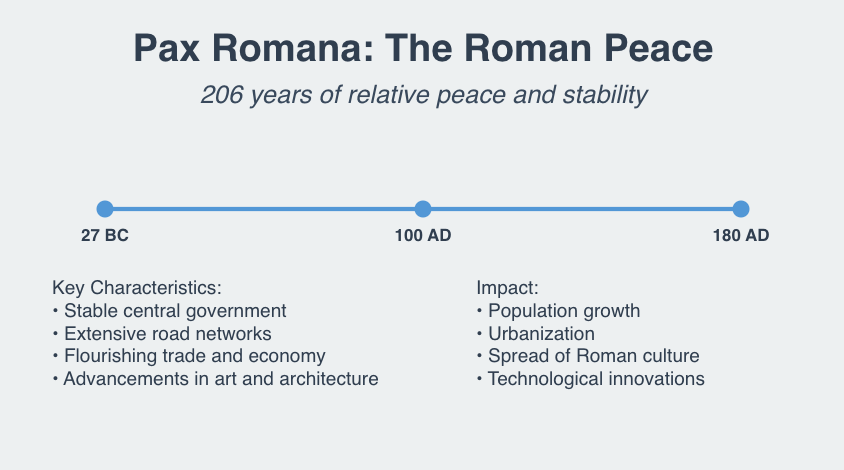
Timeline Display
Visually present time sequences and historical events

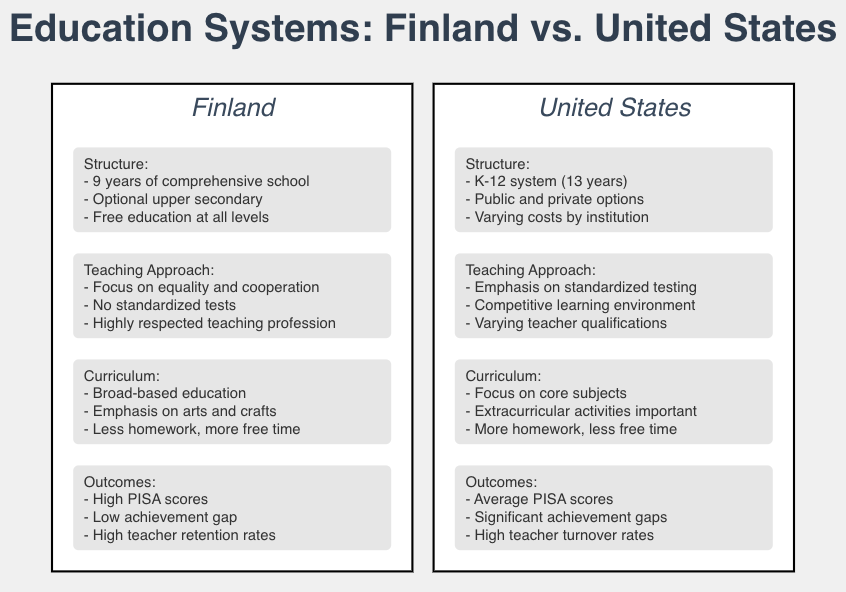
Comparison Analysis
Compare pros and cons of different options or solutions
All examples are automatically generated by AI, no human design required
Our intelligent infographic generator combines advanced AI technology with professional design principles to help you create compelling visual content effortlessly.
One-Click Generation
Simply input your text and let our AI transform it into a professional infographic. No design skills required.
Smart Analysis
AI-powered content analysis automatically identifies key concepts, relationships, and data patterns in your text.
Professional Design
Automatically applies professional design principles for layout, typography, and color schemes.
Flexible Output
Generate SVG format infographics that are easy to edit and customize further.
Types of Infographics You Can Create
Our AI can generate various types of infographics to suit your specific content needs. Each type is optimized for different information presentation goals.
Statistical Infographics
Transform complex data and statistics into easy-to-understand visual representations. Perfect for reports, presentations, and data-driven content.
Key Benefits:
Simplifies complex data
Increases information retention
Highlights key metrics
Timeline Infographics
Visualize chronological events, historical data, project timelines, or any sequence of events in a clear, engaging format.
Key Benefits:
Shows progression over time
Clarifies sequence of events
Highlights key milestones
Process Infographics
Illustrate steps in a process, workflow, or procedure with clear visual guidance. Ideal for tutorials, guides, and explaining complex processes.
Key Benefits:
Clarifies complex procedures
Improves process understanding
Enhances workflow efficiency
Comparison Infographics
Compare and contrast different options, products, ideas, or concepts side by side. Perfect for decision-making content and product comparisons.
Key Benefits:
Facilitates decision making
Highlights key differences
Presents balanced information
Hierarchical Infographics
Display organizational structures, taxonomies, or any hierarchical relationships. Ideal for organizational charts, categorizations, and nested concepts.
Key Benefits:
Clarifies organizational structure
Shows relationships between elements
Simplifies complex hierarchies
List-Based Infographics
Transform simple lists into engaging visual content. Perfect for tips, features, benefits, and any content that can be presented as a list.
Key Benefits:
Enhances readability of lists
Increases visual engagement
Simplifies complex information
Design Principles Our AI Applies
Our AI automatically applies these professional design principles to every infographic it creates, ensuring high-quality, effective visual communication without requiring design expertise.
Visual Hierarchy
Organizing elements to show their order of importance, guiding viewers through the content in a deliberate sequence.
How our AI applies this:
Automatically sizes elements based on importance
Places key information in focal areas
Uses contrast to highlight critical data
Color Theory
Strategic use of color to convey meaning, create emotional responses, and enhance readability and comprehension.
How our AI applies this:
Selects harmonious color palettes
Uses color to categorize related information
Ensures sufficient contrast for readability
Alignment
Creating order and organization by ensuring elements are properly aligned, creating clean visual connections.
How our AI applies this:
Creates consistent alignment patterns
Aligns related elements to show relationships
Maintains grid-based layouts for clarity
White Space
Strategic use of empty space to improve readability, focus attention, and create a clean, professional appearance.
How our AI applies this:
Balances content density with breathing room
Uses margins to frame important information
Prevents visual clutter and cognitive overload
Typography
Selection and arrangement of typefaces to enhance readability, establish tone, and create visual interest.
How our AI applies this:
Selects appropriate fonts for content type
Creates typographic hierarchy for scanning
Maintains consistent font usage for cohesion
Data Visualization
Transforming complex data into clear, accurate, and meaningful visual representations that reveal patterns and insights.
How our AI applies this:
Selects optimal chart types for data relationships
Simplifies complex data without distortion
Uses visual cues to highlight key insights
AI Infographics vs. Traditional Methods
See how our AI-powered approach compares to traditional infographic creation methods in terms of efficiency, expertise required, and results.
| Feature Comparison | Traditional Method | AI Infographic Generator |
|---|---|---|
| Design Expertise Required | High | None |
| Creation Time | 1-3 hours | Seconds |
| Learning Curve | Steep | Minimal |
| Content Analysis | Manual | Automatic |
| Design Principles Application | Manual | Automatic |
| Visualization Type Selection | Manual | AI-Optimized |
| Cost | $$$ | $ |
| Consistency | Variable | High |
| Iteration Speed | Slow | Instant |
| Software Required | Multiple Programs | Web Browser Only |
The Bottom Line
Our AI Infographic Generator saves you time, money, and the frustration of learning complex design software, while still producing professional-quality results that effectively communicate your information.
Key Benefits
Professional Advantages
Save hours of manual design work
No need for professional design software
Consistent, high-quality output
Easy customization options
Business Benefits
Enhanced presentation impact
Better information retention
Improved engagement rates
Professional brand image
Use Cases & Applications
Discover how our AI infographic generator can enhance your work across different scenarios
Common Scenarios
Business Presentations
Create compelling data visualizations for meetings and reports
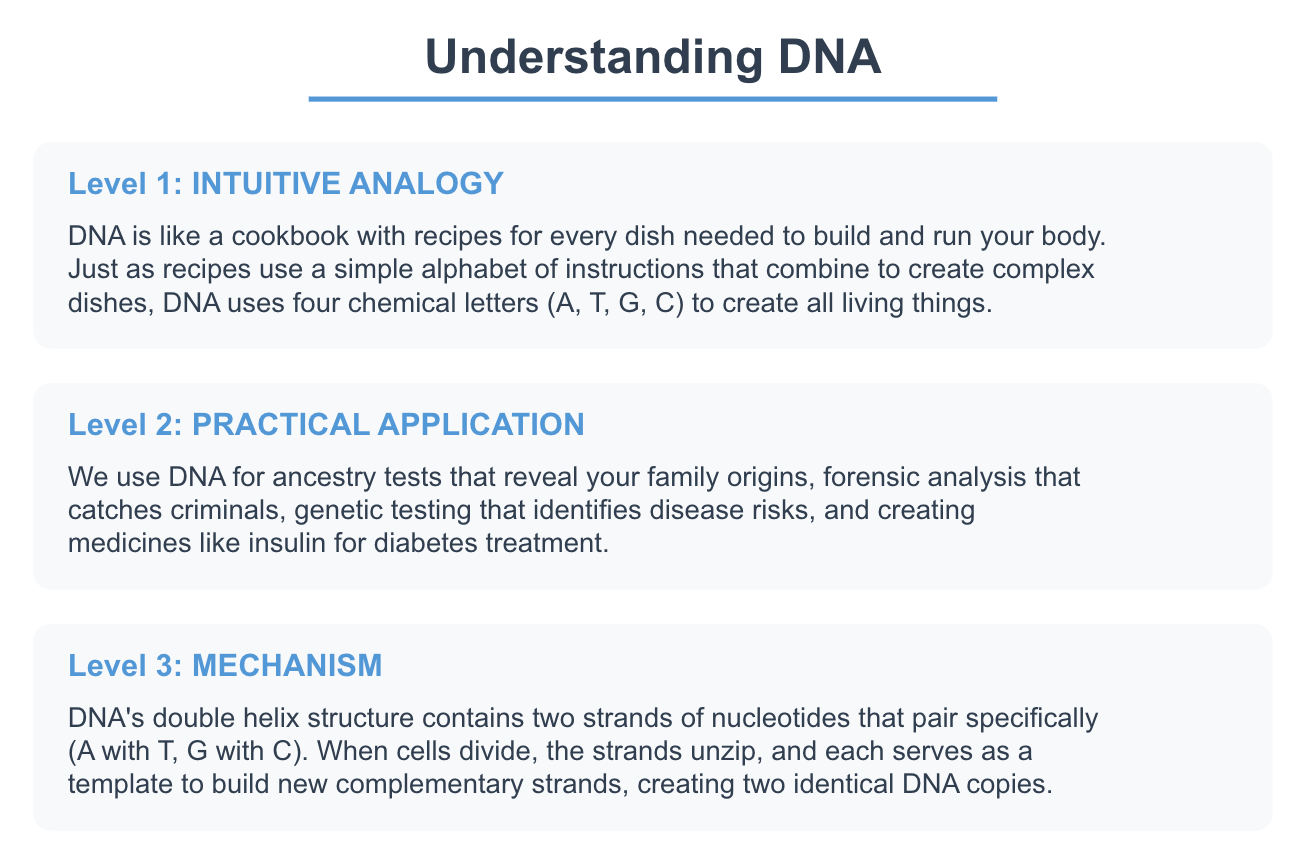
Educational Content
Transform complex concepts into easy-to-understand visuals
Marketing Materials
Design eye-catching infographics for social media and content marketing
Research Reports
Visualize research findings and data analysis results
Who Can Benefit
Business Professionals
Create professional presentations and reports quickly
Educators & Trainers
Make learning materials more engaging and effective
Content Creators
Produce high-quality visual content efficiently
Researchers
Present findings in a clear and impactful way
Success Stories: AI Infographic Generator in Action
See how professionals across different industries have used our AI Infographic Generator to solve real communication challenges and achieve measurable results.
Quarterly Sales Report Transformation
Business & FinanceChallenge:
A financial services company struggled to communicate complex quarterly sales data effectively to stakeholders, resulting in low engagement and poor information retention.
Solution:
Used the AI Infographic Generator to transform dense sales statistics into a visually compelling infographic highlighting key metrics, trends, and regional comparisons.
Educational Concept Visualization
EducationChallenge:
A university professor needed to explain complex scientific processes to undergraduate students but found traditional textbook explanations insufficient for student comprehension.
Solution:
Created a series of process-based infographics that visually broke down complex concepts into clear, sequential steps with visual cues and simplified explanations.
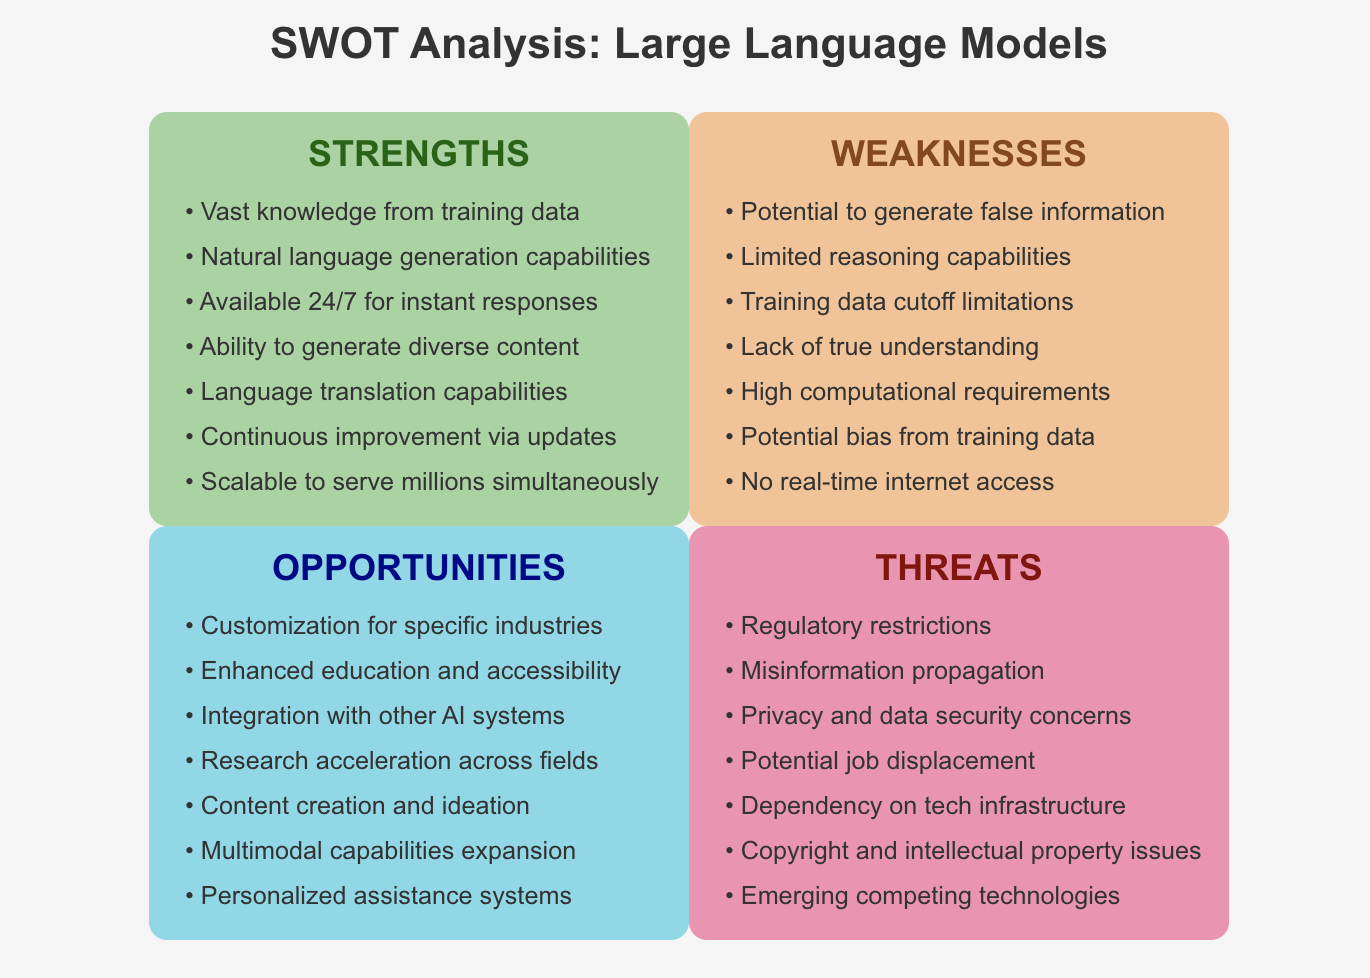
Marketing Campaign Performance
MarketingChallenge:
A digital marketing agency needed to present campaign results to clients in a more engaging way than traditional spreadsheets and reports.
Solution:
Developed comparative infographics showing before/after metrics, channel performance, and ROI calculations with visual hierarchy highlighting the most impressive results.
Research Findings Visualization
Research & DevelopmentChallenge:
A research team struggled to communicate their complex findings to non-technical stakeholders and potential funding sources.
Solution:
Created data-driven infographics that translated technical research findings into visual stories highlighting key discoveries, methodologies, and potential applications.
Ready to create your own success story?
What Our Users Say
Join thousands of users who have transformed their experience with AI Infographic Generator.
4.8 average rating
"MindLadder completely transformed how I study for medical school. The way it breaks down complex topics into progressive layers helped me understand cardiovascular physiology in a way textbooks never could. I've cut my study time by 30% while improving my grades!"
Emily Johnson
Medical Student
Stanford University
"As a high school physics teacher, I've been using MindLadder to create learning materials for my students. The 8-tier system is brilliant for gradually building understanding of difficult concepts like quantum mechanics. My students' test scores have improved by 27% since implementing these knowledge ladders."
David Martinez
Physics Teacher
Westlake High School
"Our engineering team uses MindLadder to onboard new hires to our complex software architecture. The visual nature combined with progressive complexity layers has reduced our onboarding time by 40%. It's now our standard tool for knowledge transfer across departments."
Sarah Chen
Engineering Director
Tesla
"As someone with ADHD, traditional learning resources often overwhelm me. MindLadder's visual approach and ability to explore concepts at my own pace has been a game-changer. For the first time, I can see how different ideas connect and build on each other."
Michael Rodriguez
Software Developer
Freelance
"I've been using MindLadder to prepare for my MBA courses. The way it connects business concepts through multiple layers of understanding has given me an edge in class discussions. I especially appreciate how it highlights counterintuitive aspects that challenge my assumptions."
Jennifer Park
MBA Student
Harvard Business School
"Our research team uses MindLadder to map interdisciplinary connections between AI ethics and policy. The ability to start with simple analogies and build to expert-level insights has helped us communicate complex ideas to stakeholders from diverse backgrounds."
Dr. James Wilson
Research Director
MIT Media Lab
How to Use the AI Infographic Creator?
Transform information into visually stunning infographics with these easy steps
Input Content
Enter a topic or paste text into the generation interface that you want to transform into an infographic
Customize Settings
Adjust additional settings as needed, such as generation language (default is English) and style options for your infographic
Instant Infographic Generation
Click generate and watch as AI creates a insightful infographic
Download or Share
Click the Download button to save your infographic or use the Share option to distribute it to others
Tips for Great Infographics
Focus on clear, concise information to create more effective visuals
Try different visual styles to find the one that best communicates your data
For complex topics, consider breaking content into multiple infographics focusing on different aspects
Frequently Asked Questions
Find answers to commonly asked questions about our AI Infographic Generator and how to get the most out of it.
General Questions
Technical Questions
Still have questions?
Contact our support teamReady to Create Your First Infographic?
Start for free with daily generation credits. No credit card required, begin creating now.
No credit card required. Start with free daily generations.