Transforming Text into Visual Information
Visualizing Information Automatically with AIFlow
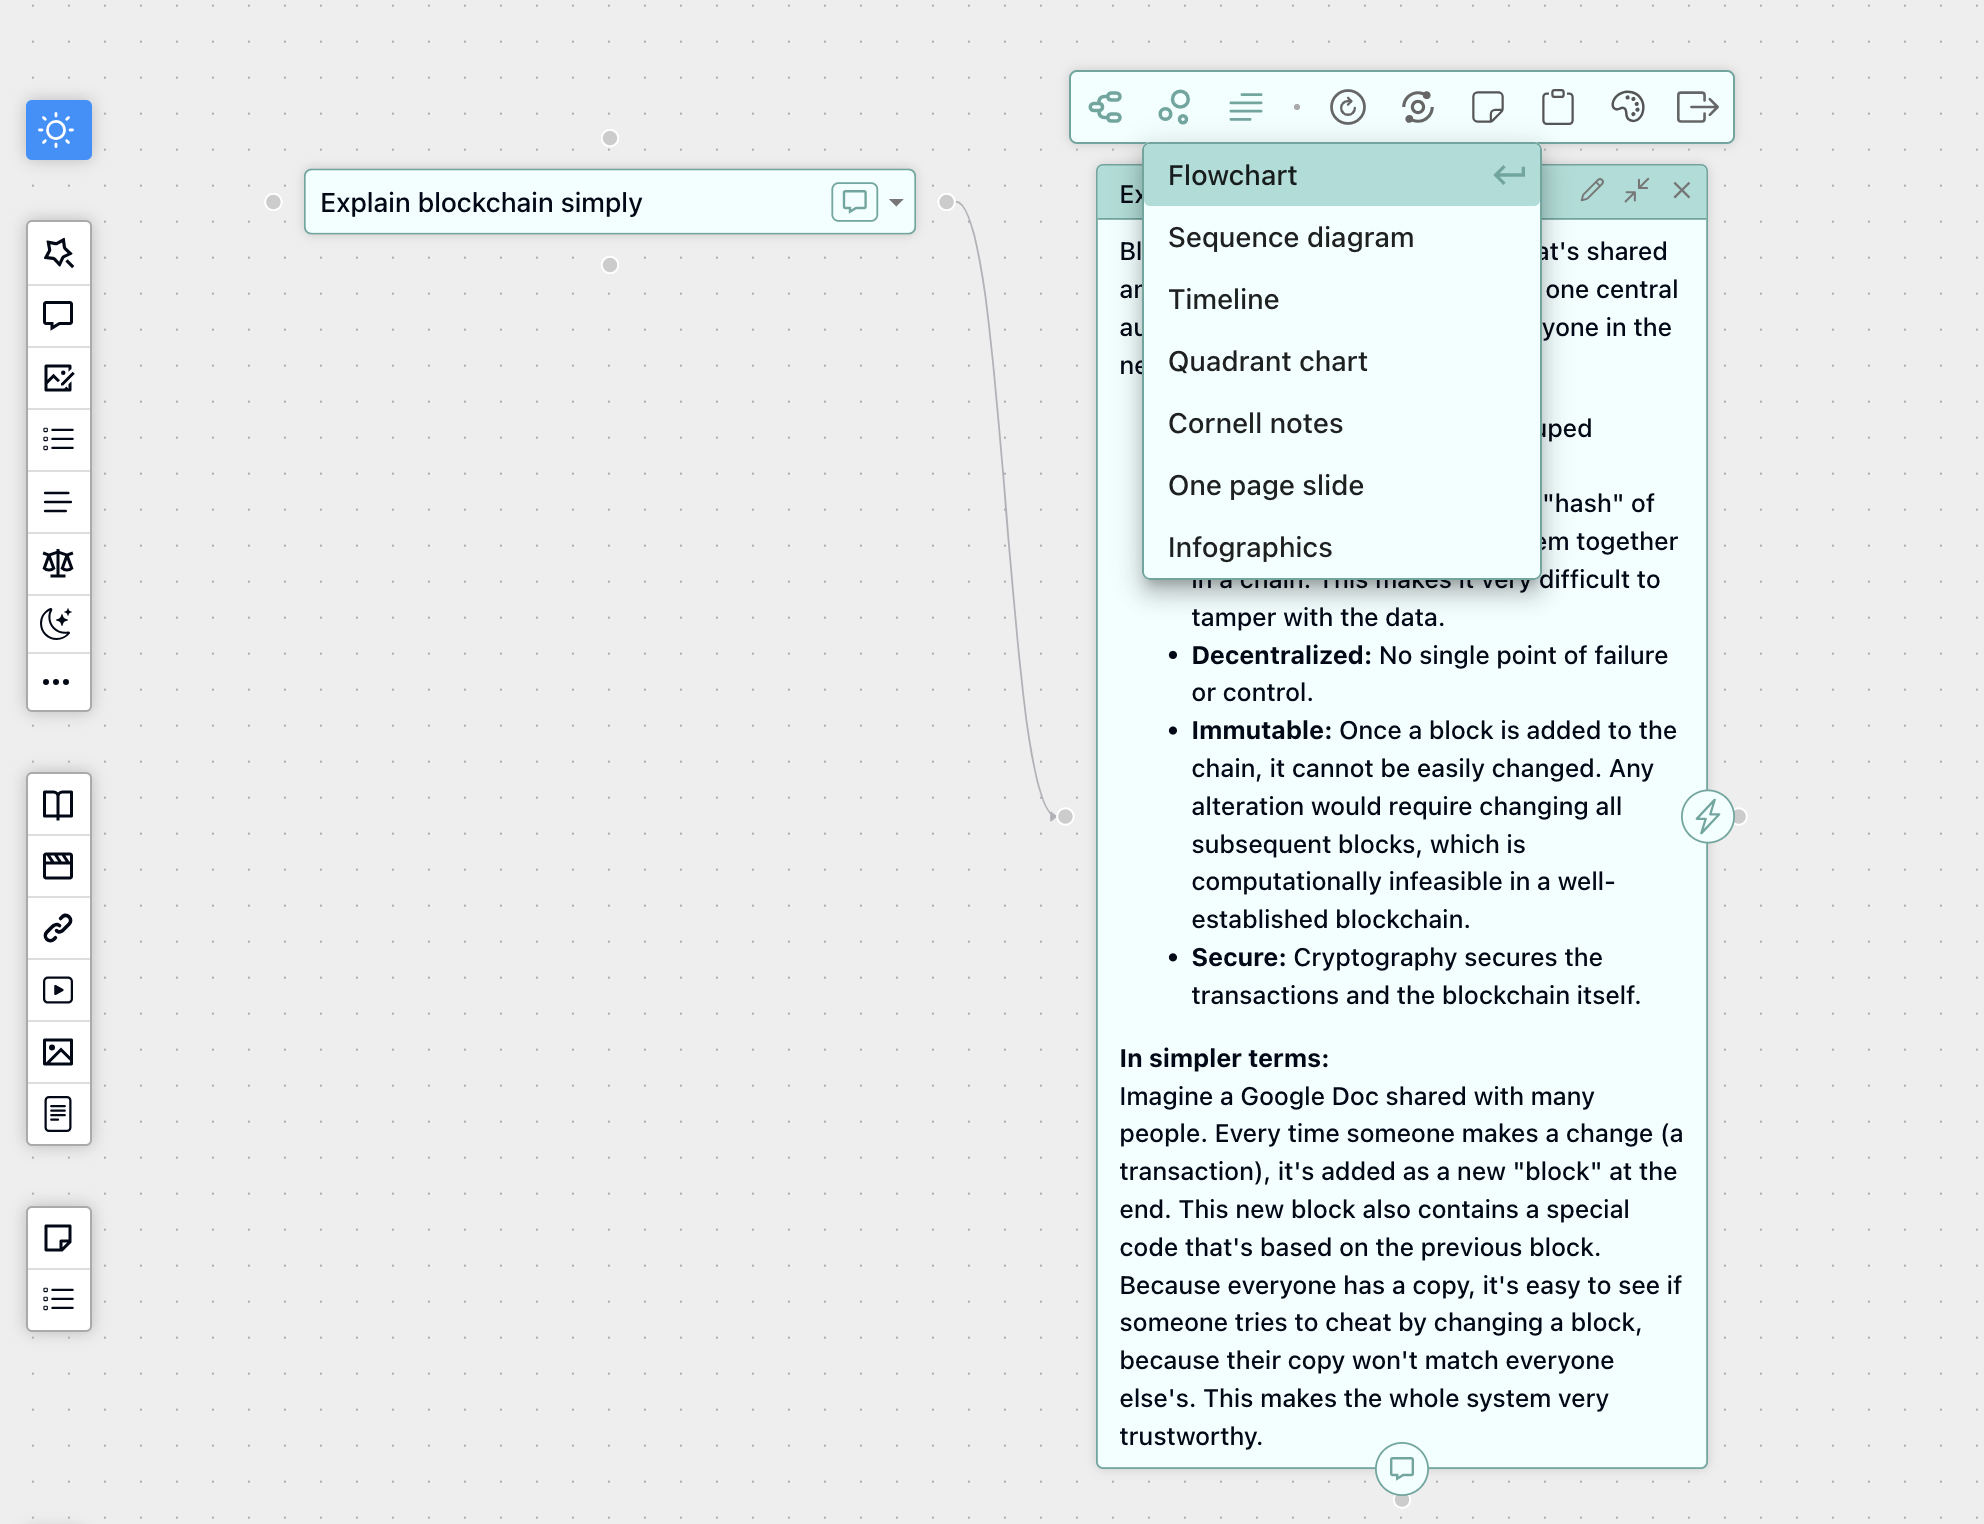
FunBlocks AIFlow goes beyond basic mind mapping and text generation. One of its most powerful features is the ability to intelligently visualize information as you work. When generating text nodes, AIFlow analyzes your content and automatically creates visual representations like flowcharts where appropriate, making complex information easier to understand, more intuitive, and more memorable.
This smart visualization feature helps transform dense text into clear visual formats that highlight relationships between concepts, processes, and ideas. Rather than manually creating diagrams, AIFlow does the work for you, identifying when information would benefit from visual representation.
Infographics Generator: Multiple Visualization Options
AIFlow's built-in Infographics Generator provides an impressive range of visualization options based on your node content:
- Infographics: Convert text into visually appealing information displays
- Flowcharts: Visualize processes, decisions, and workflows
- Sequence Charts: Display step-by-step procedures or timelines
- Timeline Visualizations: Present chronological information or project roadmaps
- Cornell Notes: Generate Cornell-style notes for any subject or content
- One-Page Slides: Create presentation-ready visuals summarizing key information
These data visualization tools help transform complex information into clear, shareable visual formats with just one click.
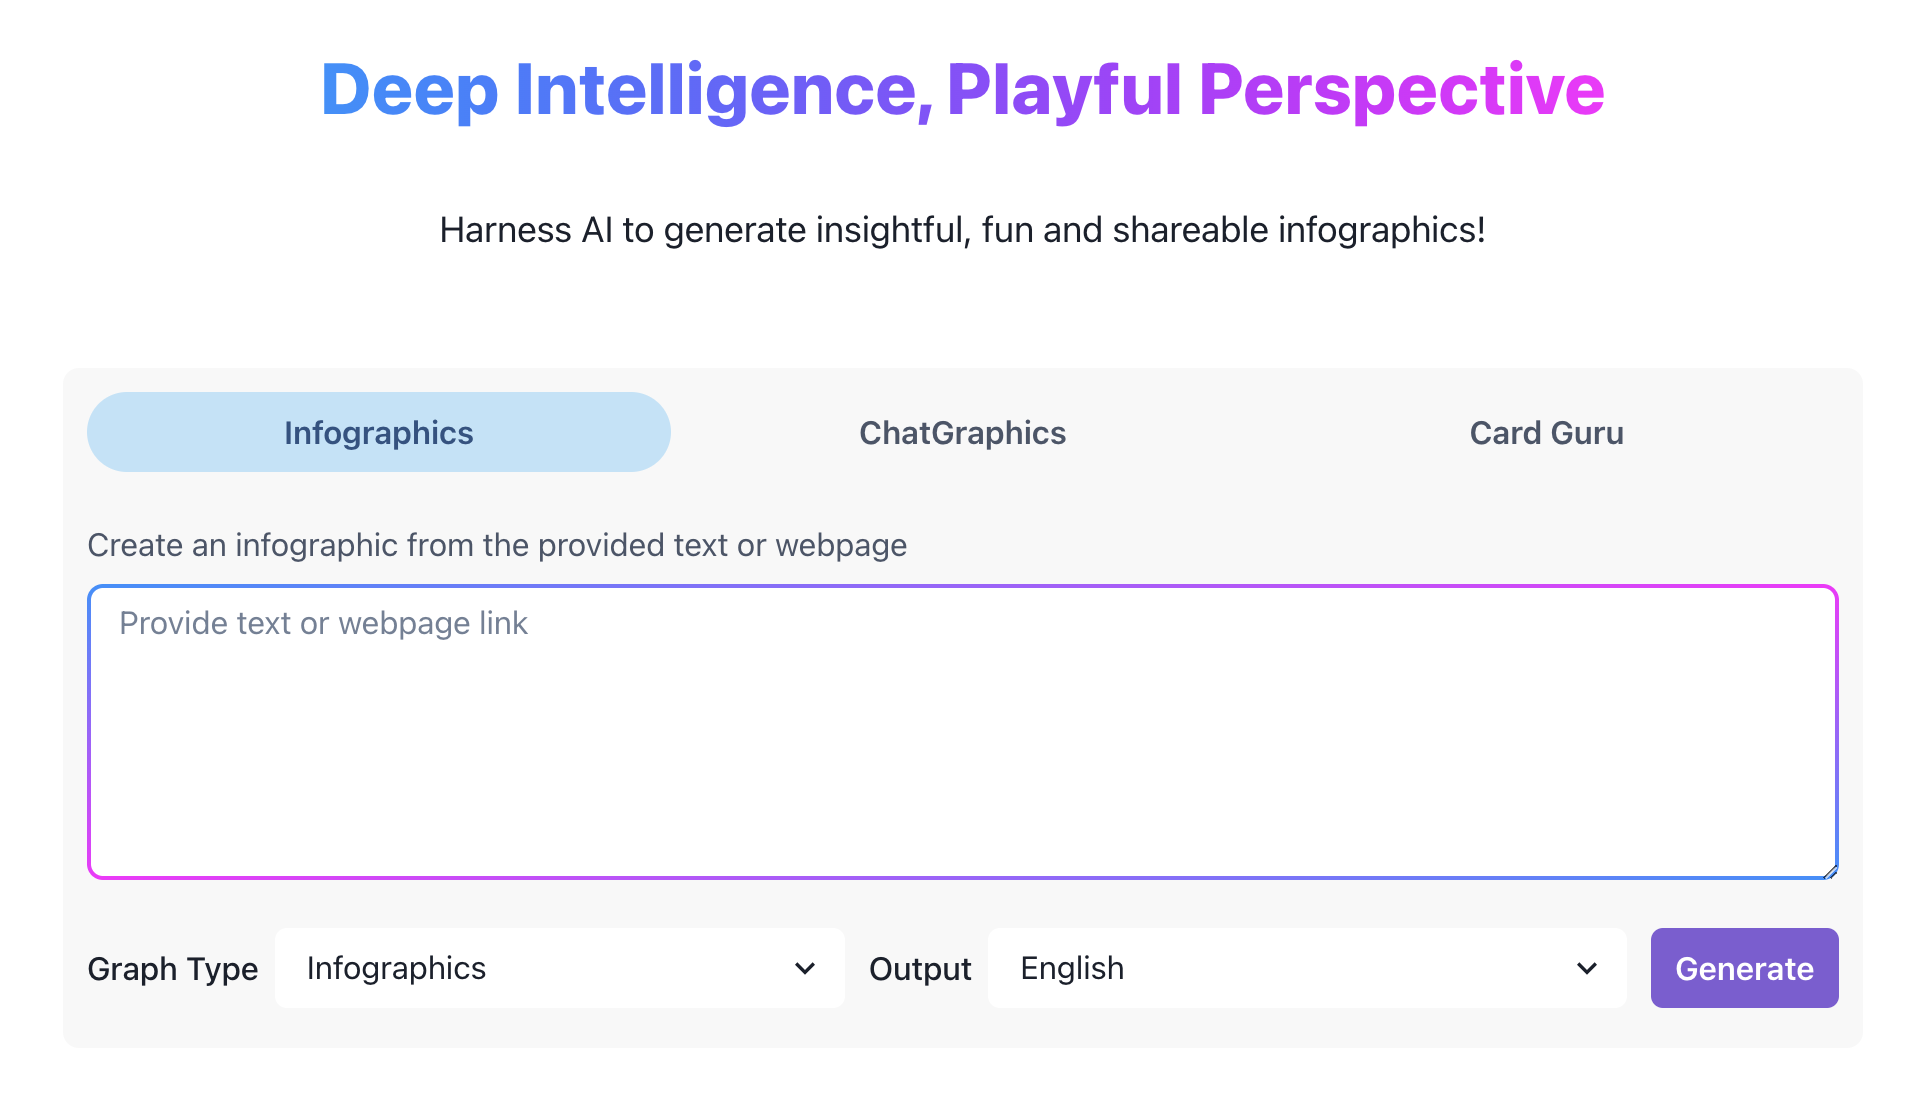
Quick Access Through FunBlocks AI Tools
For even faster visualization, FunBlocks offers direct access through its AI Tools suite at FunBlocks AI Tools. The dedicated Infographic Generator tool allows you to instantly transform text into professional infographics without even opening the full AIFlow application.
Simply visit https://www.funblocks.net/aitools/graphics, https://www.funblocks.net/aitools/infographic paste your text, and let the AI transform it into a compelling visual representation.
Why Visual Information Matters
Converting text to visual formats through flowcharts, data charts, and infographics significantly improves information retention and understanding. Research shows that visual information is processed up to 60,000 times faster than text, making AIFlow's visualization capabilities an essential productivity tool for:
- Presentations and meetings
- Education and training materials
- Project planning and documentation
- Complex data analysis and reporting
- Marketing and communication materials
By automatically identifying opportunities to transform text into visuals, FunBlocks AIFlow helps you communicate more effectively while saving time on manual diagram creation.