Kandle - Chart Insights: The Future of Instant Technical Analysis Review
Technical analysis from a chart image—nothing else needed.
发布时间: 12/27/2025
Product Overview
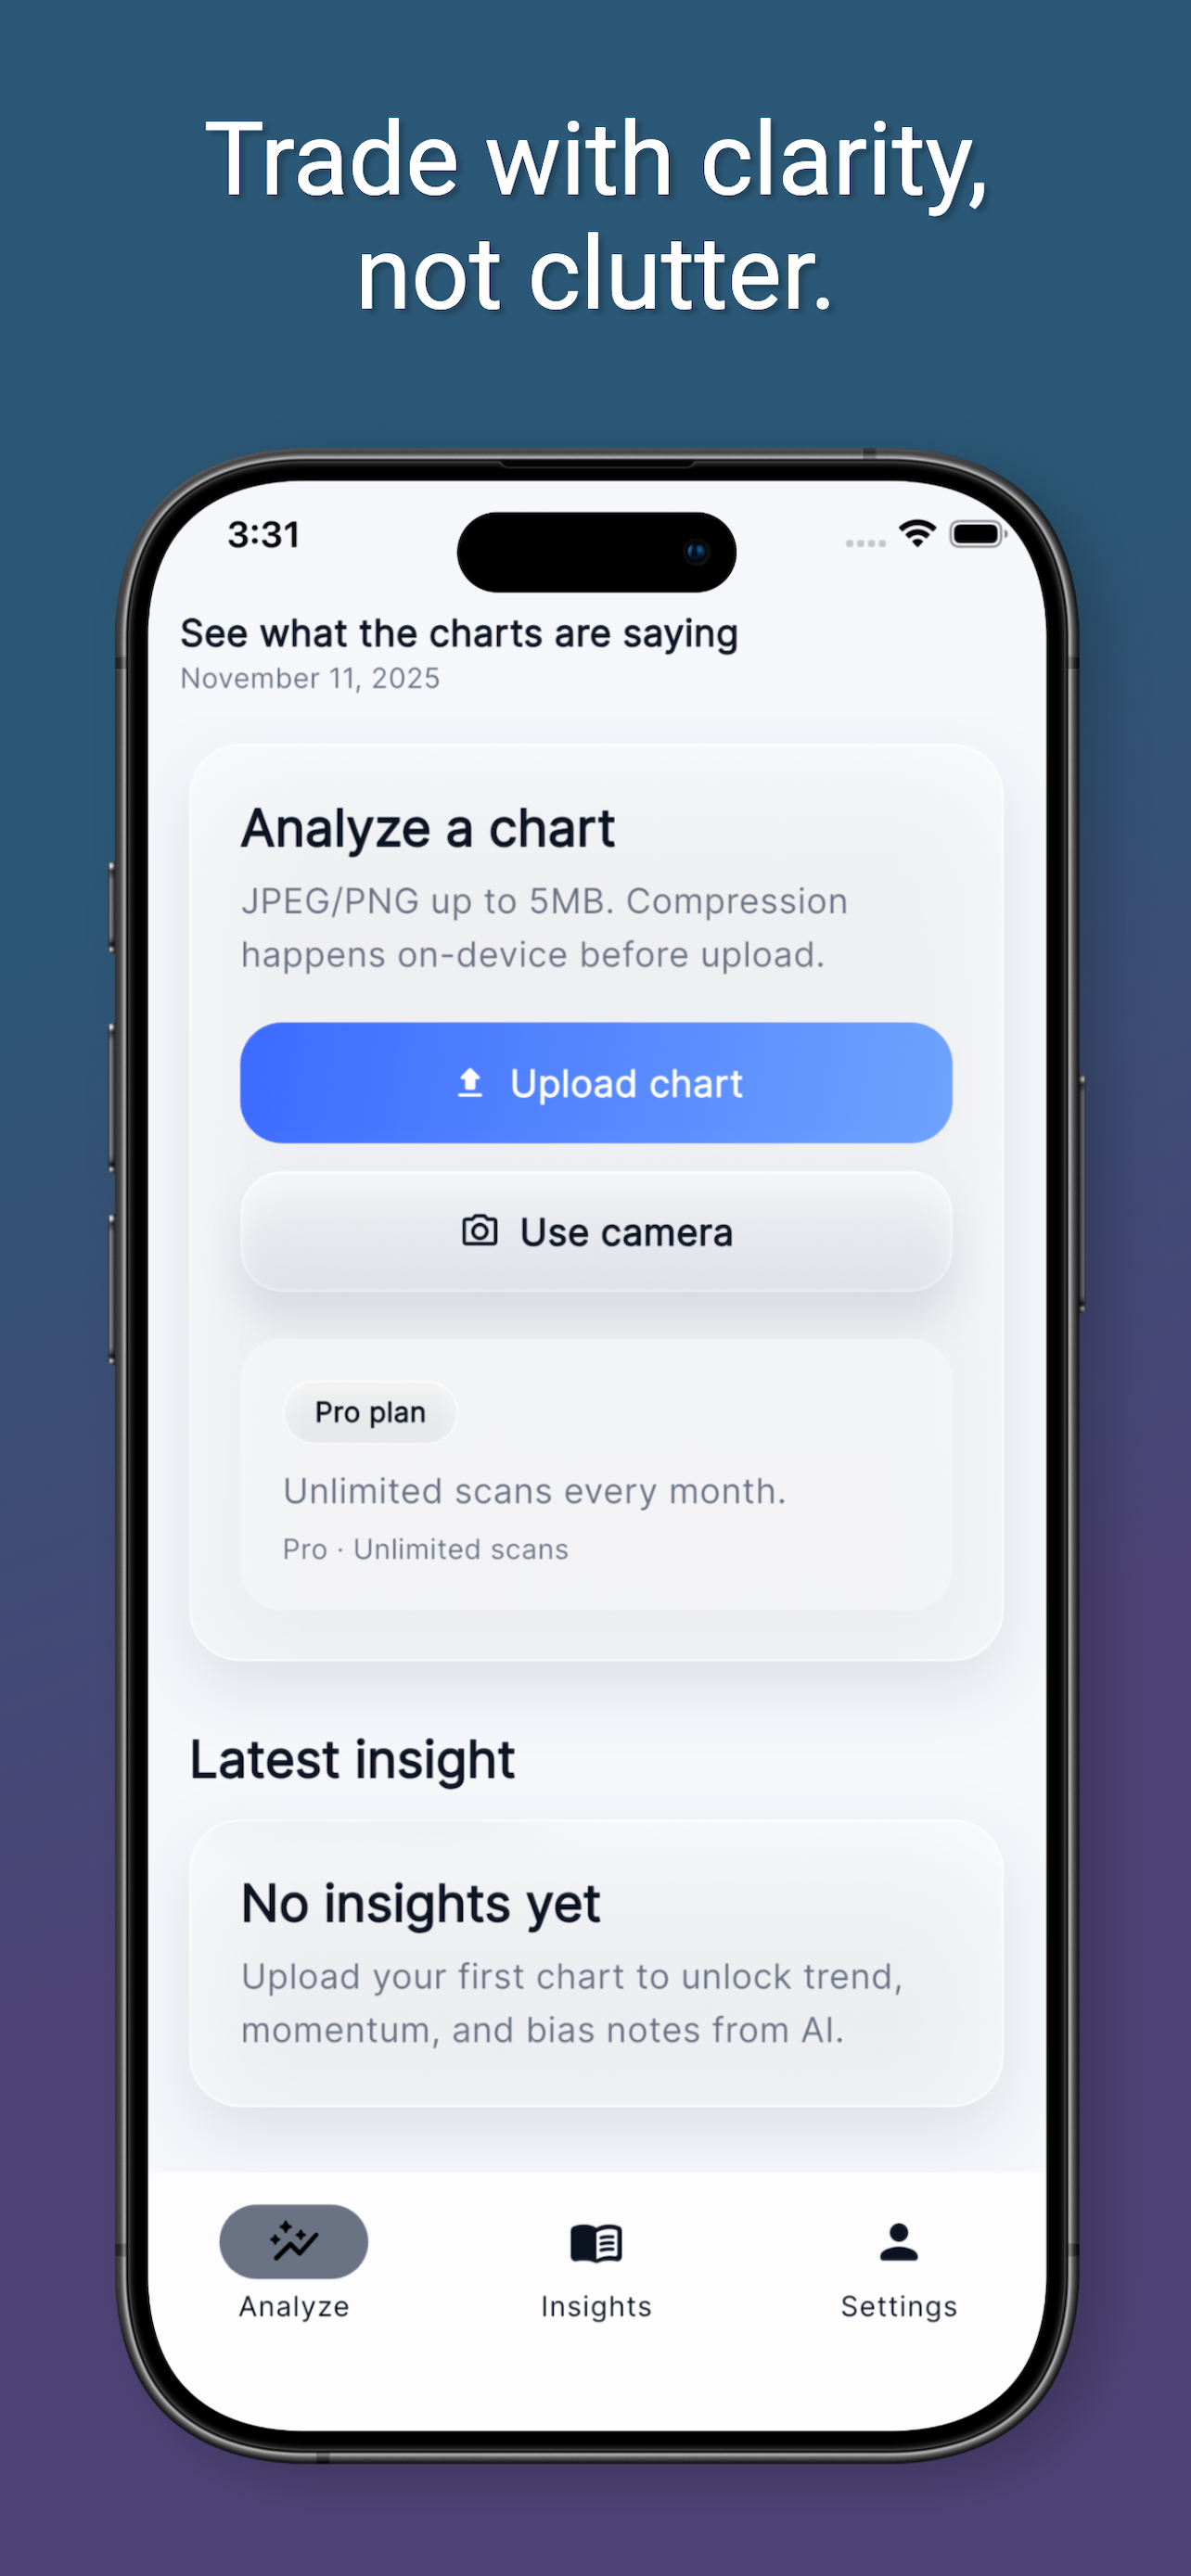
Kandle - Chart Insights is a groundbreaking tool entering the crowded financial technology (FinTech) space, specifically targeting the niche of quick, accessible technical analysis. Its core premise is elegantly simple: turn a static chart image into actionable insights instantly. Unlike traditional trading platforms that require live data feeds, custom indicator setups, and complex software configurations, Kandle operates purely on visual input. You simply upload a screenshot, a photo of a chart, or an exported image from platforms like TradingView, and within seconds, the AI-powered engine delivers a comprehensive technical breakdown.
This product is engineered for busy traders, analysts, and investors who value speed and clarity over deep, customizable charting environments. Use cases range from quickly validating an existing trade setup during a hectic market session to getting a second opinion on a potential entry point without opening your full trading terminal. Kandle’s core value proposition lies in democratizing technical analysis by removing the setup barrier—it's analysis on demand, accessible right from your camera roll.
Problem & Solution: Eliminating Charting Friction
The primary problem Kandle solves is the friction inherent in modern technical analysis workflows. For many traders, setting up indicators, drawing trendlines, and manually synthesizing market structure takes precious time, especially when volatility strikes or when reviewing multiple assets away from a primary workstation. Existing solutions are often either too complex (professional charting suites) or too manual (requiring the user to interpret everything themselves).
Kandle cuts through this noise. By leveraging advanced computer vision and AI, it extracts critical market data—trend direction, identified key support/resistance levels, recognizable chart patterns, and potential future scenarios—directly from the visual data provided. It fills a crucial market gap for users who need "fast clarity." Instead of spending five minutes drawing Fibonacci retracements, Kandle provides a plain-language summary based on what it sees in the image, making complex technical jargon accessible.
Key Features & Highlights
Kandle shines in its streamlined approach to delivering high-value intelligence from low-effort input. The technology powering Kandle is robust enough to not just identify candlesticks but also interpret the context of pre-set indicators if they are visible in the upload.
Key highlights that set Kandle apart include:
- Image-Based Input: The ability to process screenshots, photos, and exported charts makes it incredibly versatile across desktop and mobile trading environments.
- Plain Language Interpretation: The output focuses on clear explanations of the trend, structure, and scenario possibilities, sidestepping confusing technical jargon for quick comprehension.
- Automated Level Identification: Kandle automatically identifies and reports on significant horizontal levels (support/resistance) visible in the chart structure.
- Contextual Insight: If the uploaded chart already features indicators (like RSI or MACD), Kandle incorporates these into its analysis, demonstrating sophisticated visual processing capabilities.
The user experience is refreshingly minimalist. There are no complex dashboards to navigate; the workflow is strictly: Upload $\rightarrow$ Analyze $\rightarrow$ Receive Insight. This focus on a single, high-utility function makes Kandle incredibly efficient for on-the-go trading validation.
Potential Drawbacks & Areas for Improvement
While Kandle offers revolutionary simplicity, its reliance on static images inherently imposes certain limitations. The most significant drawback is the inability to interact with live data. Since it analyzes a snapshot, the analysis becomes immediately dated as soon as the next candle prints. Traders relying on high-frequency analysis or real-time adjustments will find Kandle a reference tool rather than a primary execution platform.
For future enhancement, I would suggest focusing on broadening the scope of automated recognition. While structure and basic indicators are covered, integrating recognition for more complex patterns (like Elliott Wave counts or specific harmonic patterns) could significantly boost its utility for advanced users. Furthermore, allowing users to "correct" a misidentified level on the image before generating the final report might help fine-tune the AI model over time and improve accuracy based on user preference.
Bottom Line & Recommendation
Kandle - Chart Insights is a fantastic innovation for the modern trader looking to augment their workflow without adding complexity. It excels at providing rapid, objective technical sanity checks.
Who should try Kandle? I highly recommend Kandle for intermediate to expert traders who frequently review charts across various platforms (and capture screenshots often) and need a fast, unbiased second opinion on market structure and key levels. It’s also excellent for beginners transitioning from theory to practical analysis, as the plain-language summary serves as a great learning aid. If you value speed and clarity delivered directly from a chart image, Kandle is a must-try tool that successfully lowers the barrier to quality technical interpretation.
Featured AI Applications
Discover powerful tools to enhance your productivity
MindMax
与AI互动的新方式
超越 AI 聊天,将对话转化为无限画布。结合头脑风暴、思维导图、批判性与创造性思维工具,帮助你可视化想法、高效解决问题、加速学习。
AI Slides
AI 驱动幻灯片,Markdown 魔法加持
革命性幻灯片创作,融合 AI 智能与 Markdown 灵活性 - 随处编辑,随时优化,轻松迭代。让每个想法,都能快速变成专业演示。
AI Markdown Editor
打开即写 - AI驱动的Markdown编辑器
极其高效的写作体验:AI助手、斜杠命令、极简界面。打开即用,轻松写作。✍️ Markdown简洁 + 🤖 AI强大 + ⚡ 斜杠命令 = 完美写作体验
FunBlocks AI Extension
🚀 AI驱动的浏览器扩展
用FunBlocks AI助手改变您的浏览体验。您的智能伴侣,为网络上的AI驱动阅读、写作、头脑风暴和批判性思维提供支持。