Series Graph: Your Visual Guide to Binge-Watching Brilliance
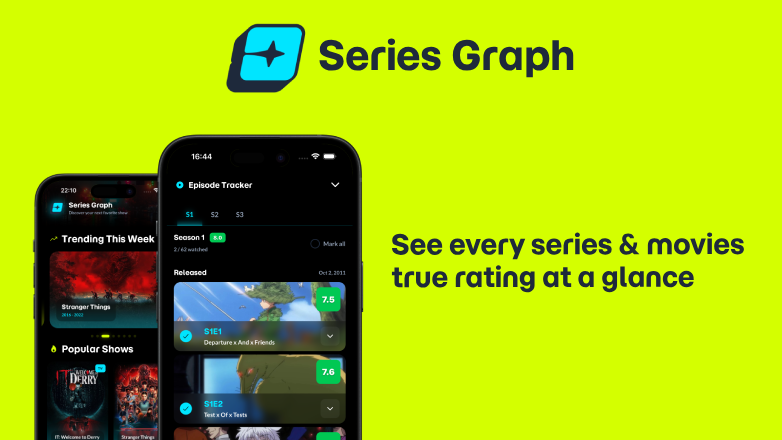
See every series & movies true rating at a glance
发布时间: 12/7/2025
Series Graph is a fresh take on the TV and movie companion app, designed for discerning viewers who want to make the most of their watch time. It transforms raw IMDb ratings into visually intuitive, episode-by-episode heatmaps, allowing users to quickly identify the best and worst parts of a series. Aimed at anyone tired of committing to a show only to find it declines in quality, Series Graph offers a data-driven approach to content discovery and tracking.
This innovative tool helps you instantly spot which seasons peak, which episodes are skippable, and even where to stream your desired content—all within an ad-free interface. The core value proposition lies in saving users time and enhancing their viewing experience by providing clear insights into a show's quality progression, season by season and episode by episode.
Problem & Solution: Battling Binge-Watching Blunders
The common problem Series Graph addresses is the frustration of investing hours into a TV series, only for its quality to dip significantly, leading to wasted time and disappointment. Many viewers rely on overall series ratings, which can be misleading as they don't account for fluctuations in quality across seasons or individual episodes. Existing solutions often involve manually sifting through episode reviews or relying on anecdotal recommendations, which can be time-consuming and unreliable.
Series Graph solves this by providing a visual heatmap of IMDb ratings for every episode. This visual representation, similar to a time series graph that displays data points in chronological order to show trends, immediately highlights patterns in a show's quality. Unlike traditional rating aggregators, Series Graph offers a granular, episode-level breakdown, making it easy to see "the journey, not just the snapshot" of a series' quality over time. This fills a market gap for a streamlined, data-visualization-focused tool for TV and movie enthusiasts.
Key Features & Highlights: Spotting Gems and Skipping Filler
The standout features of Series Graph revolve around its powerful data visualization and user-friendly interface:
- Visual Heatmaps of IMDb Ratings: The core of Series Graph is its ability to convert complex IMDb rating data into easily digestible heatmaps. This allows users to grasp the "true rating at a glance" for every episode and season, quickly identifying high-rated "gems" and low-rated "filler." This visual approach makes trends and outliers immediately apparent.
- Episode-by-Episode Insights: Rather than just a single series rating, Series Graph provides a detailed view of how a show's quality evolves. This is particularly useful for long-running series where quality can vary drastically.
- Streamlined Tracking: Users can mark episodes and movies as watched, track their progress across seasons, and keep their watch history synchronized across multiple devices. This acts as a personalized viewing diary.
- Ad-Free Experience: A significant highlight is the commitment to a completely free and ad-free experience, enhancing user satisfaction and focusing solely on content insights.
- Where to Stream Information: Beyond ratings, the app also helps users find where to stream the content, adding another layer of convenience.
The intuitive nature of the heatmaps and the ability to quickly assess a show's trajectory make Series Graph a highly effective tool for content discovery and management.
Potential Drawbacks & Areas for Improvement
While Series Graph offers a compelling solution, there are a few areas for potential enhancement.
- Reliance on IMDb Ratings: The product's core functionality is heavily dependent on IMDb ratings. While a widely recognized source, diversifying rating sources (e.g., Rotten Tomatoes, Metacritic) could offer a more comprehensive and balanced perspective, especially for shows with more polarized opinions.
- Limited Social Features (Currently): The maker has indicated plans for lightweight social features like sharing graphs and comparing with friends. Implementing these could significantly boost user engagement and community building around shared viewing habits.
- Discovery Beyond Existing Knowledge: Currently, Series Graph excels at providing insights into shows users are already considering. Future enhancements could include smarter discovery features based on personal ratings and viewing habits to recommend new series or movies that align with a user's preferences.
- Personalized Ratings and Notes: The maker mentioned personal ratings and notes as a future feature. This would add a valuable layer of personalization, allowing users to overlay their own opinions on the objective IMDb data.
Bottom Line & Recommendation
Series Graph is an excellent tool for anyone who loves TV series and movies but wants to be more intentional with their viewing choices. If you're tired of starting shows that fizzle out or want to revisit classics efficiently, Series Graph is a must-try. Its unique visual heatmaps provide actionable insights that are hard to glean from traditional rating systems, and the ad-free, free-to-use model makes it incredibly appealing. It’s particularly recommended for data-savvy viewers, binge-watchers, and those who frequently seek show recommendations. Give Series Graph a try to transform your TV and movie exploration from a gamble into a guided experience.
Featured AI Applications
Discover powerful tools to enhance your productivity
MindMax
与AI互动的新方式
超越 AI 聊天,将对话转化为无限画布。结合头脑风暴、思维导图、批判性与创造性思维工具,帮助你可视化想法、高效解决问题、加速学习。
AI Slides
AI 驱动幻灯片,Markdown 魔法加持
革命性幻灯片创作,融合 AI 智能与 Markdown 灵活性 - 随处编辑,随时优化,轻松迭代。让每个想法,都能快速变成专业演示。
AI Markdown Editor
打开即写 - AI驱动的Markdown编辑器
极其高效的写作体验:AI助手、斜杠命令、极简界面。打开即用,轻松写作。✍️ Markdown简洁 + 🤖 AI强大 + ⚡ 斜杠命令 = 完美写作体验
FunBlocks AI Extension
🚀 AI驱动的浏览器扩展
用FunBlocks AI助手改变您的浏览体验。您的智能伴侣,为网络上的AI驱动阅读、写作、头脑风暴和批判性思维提供支持。